Credit Risk and Dollarization in Cambodia
A Dual-Currency Analysis Using Interest Rate Spreads (2013–2025)
Cambodia’s local currency (riel) credit market has decoupled from US Federal Reserve influence since COVID-19. Before the pandemic, the Fed effectively set borrowing costs across Cambodia’s entire banking system. After COVID, it lost its grip on riel-denominated lending — a sign that local monetary conditions are becoming more independent.
NBC domestic policy is gaining real traction. For the first time, National Bank of Cambodia policy actions are statistically influencing even the dollar-denominated lending segment, suggesting that de-dollarization efforts are bearing fruit.
Riel lending remains structurally riskier than dollar lending. The riel segment carries 2–4× higher implied default risk, is more volatile, and recovers more slowly from shocks — a risk premium that policymakers and banks must account for as de-dollarization advances.
Why Does This Matter?
Cambodia’s banking system is one of the most dollarized in the world: roughly 80% of all bank lending is in US dollars, not in the national currency (the riel). This means that when the US Federal Reserve raises or lowers interest rates, it directly affects borrowing costs for Cambodian businesses and households — even though Cambodia has its own central bank (the NBC).
This research asks a simple but important question: Is Cambodia’s credit risk truly controlled by the US Fed, or is the local central bank gaining influence? We build a data-driven Credit Risk Index to answer this.
Research Topic
This project constructs currency-specific and system-wide Credit Risk Indices (CRIs) for Cambodia’s dual-currency banking sector. Cambodia’s economy is highly dollarized: approximately 80% of bank lending is denominated in US dollars, while the remaining 20% operates in Cambodian riel (KHR). This structural feature creates a unique vulnerability – domestic credit conditions are directly exposed to US Federal Reserve policy decisions. We investigate whether the two currency segments exhibit distinct risk dynamics and whether COVID-19 triggered a structural decoupling between them.
Methodology Overview
Our analytical framework proceeds in 16 steps, each structured around four dimensions: Framework (conceptual basis), What (the computation), Why (the justification), and How (the implementation). The complete methodology is detailed on the Methodology page.
Core Pipeline
| Step | Method | Purpose |
|---|---|---|
| 1 | Interest Rate Spread | Compute the gap between term loan and term deposit rates for each currency |
| 2 | Ornstein-Uhlenbeck Model (a model that assumes risk levels tend to drift back toward a normal level over time) | Model spreads as mean-reverting processes (random processes that naturally return to an average) |
| 3 | Maximum Likelihood Estimation | Estimate model parameters with exact Gaussian transition density |
| 4 | AR(1) Cross-Check | Independent validation of model parameter estimates via OLS |
| 5 | Crisis Threshold | Define currency-specific thresholds at the 95th percentile (the level exceeded only during the worst 5% of historical periods) |
| 6 | Crisis Probability | Compute the probability that spreads exceed the threshold at each point in time |
| 7 | Currency CRI | Combine normalized volatility and crisis probability into a composite index |
| 8 | System CRI | Aggregate USD and KHR CRIs using loan-share weights |
Extended Analyses
| Step | Method | Purpose |
|---|---|---|
| 9 | Stress Testing | Evaluate CRI response to hypothetical adverse shocks (10%, 30%, 50%) |
| 10 | COVID-19 Sub-Period Analysis | Test for structural parameter shifts across pre-COVID, COVID, and post-COVID periods |
| 11 | Rolling Window Analysis | Track parameter evolution over time using a 36-month rolling window |
| 12 | Robustness Checks | Verify findings under alternative rates, thresholds, and weights |
| 13 | Regime-Switching OU Model | Allow parameters to shift between latent calm and stress states |
| 14 | Dynamic Threshold CRI | Replace static crisis threshold with a rolling 36-month threshold |
| 15 | Implied Default Probability | Estimate the probability of default from market prices (rather than using abstract hazard rates) |
| 16 | Policy Divergence (VAR) | Vector Autoregression (a model tracking how multiple variables influence each other over time) — test whether US monetary policy transmits to each currency segment |
Key Results and Findings
1. NBC Policy Gaining Traction
A surprise finding: NBC domestic monetary policy began influencing USD spreads post-COVID (p = 0.0021)1, suggesting that local policy levers are gaining enough influence to spill over into the dollarized segment. This is a potential early indicator of advancing de-dollarization — the NBC’s own interest rate tools are beginning to shape borrowing costs even in the dollar segment.
2. The Decoupling Hypothesis — Confirmed
The most striking finding of this research is the post-COVID decoupling of the KHR credit market from US monetary policy:
- Pre-COVID: The US Federal Funds Rate Granger-caused (statistically helped predict) both USD and KHR spreads (p < 0.001 for both). The Fed effectively set borrowing costs across the entire Cambodian banking system.
- Post-COVID: The Fed Funds Rate continues to influence USD spreads (p = 0.0165), but has lost its influence over KHR spreads (p = 0.1592). The riel segment has decoupled from US monetary policy.
This decoupling is corroborated by three independent methods:
| Method | Evidence |
|---|---|
| Rolling Correlations | Correlation between KHR spread and FFR inverted from +0.77 (pre-COVID) to −0.46 (post-COVID) |
| Granger Causality (does one variable help predict another?) | FFR→KHR p-value shifted from 0.0000 to 0.1592 |
| Impulse Response Functions (charts showing how a shock in one variable ripples through another over time) | KHR spread shows near-zero response to FFR shocks; confidence bands include zero at all horizons |
3. COVID-19 as a Structural Break
COVID-19 did not merely produce a transitory spike in credit risk – it triggered a permanent regime shift. Post-COVID parameters have not reverted to pre-COVID levels for either currency. The KHR segment absorbed a disproportionately larger shock, with its equilibrium spread shifting to a higher level and its volatility remaining elevated.
4. Structural Risk Asymmetry
The KHR segment exhibits structurally higher credit risk than the USD segment across all metrics. KHR spreads are wider, more volatile, and revert to equilibrium more slowly. This is consistent with the exchange rate risk premium that lenders demand for riel-denominated lending in a dollarized economy.
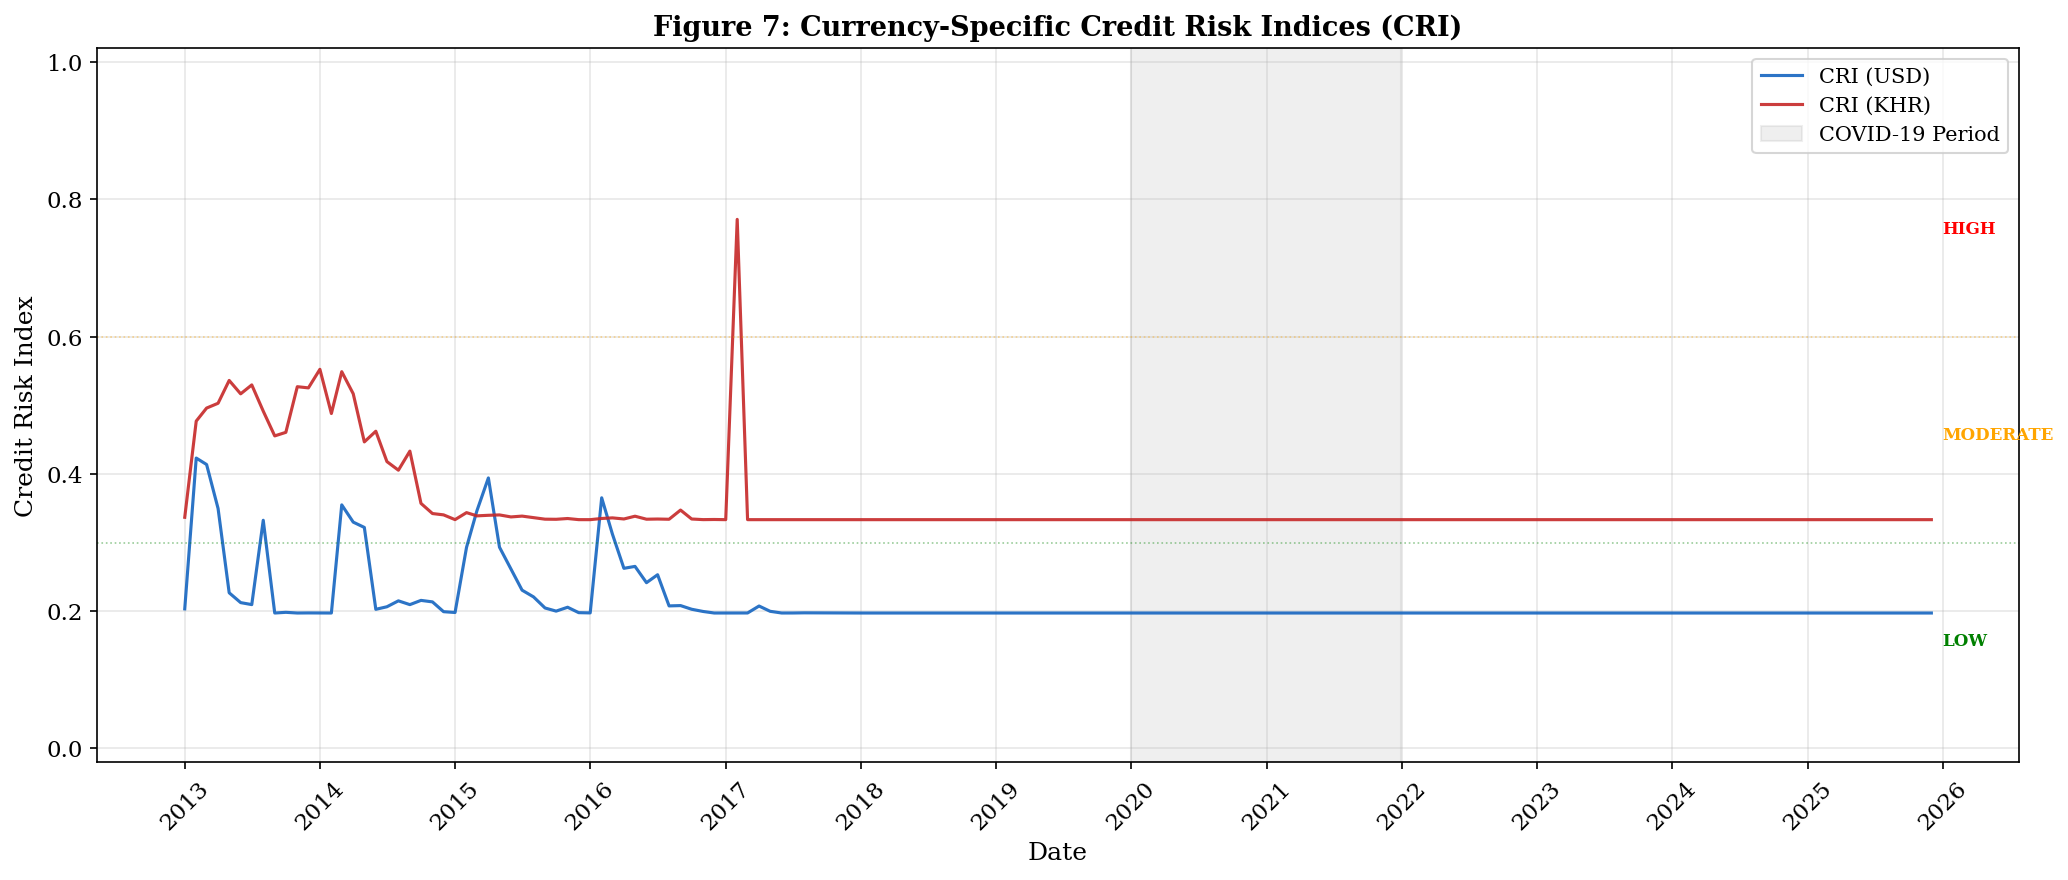
Key Chart: Credit Risk Indices Over Time
The chart below shows how credit risk in the USD (blue) and KHR (red) segments has evolved from 2013 to 2025. The shaded area marks the COVID-19 period. Notice how KHR risk is consistently higher, and both currencies show a permanent shift after the pandemic.
5. Regime Switching Confirms Instability
The two-state Markov Regime-Switching OU model identifies distinct calm and stress regimes for both currencies. The KHR segment spends more time in the stress regime, confirming its higher inherent instability. The regime-switching model is favored over the standard OU model by the BIC criterion (a standard statistical test for comparing models — lower BIC means a better fit).
6. Stress Test Results
Under a severe stress scenario (50% spread increase), the KHR CRI responds more dramatically than the USD CRI, confirming that the riel segment amplifies credit stress more strongly. The dominant USD segment (80% of lending) remains the primary driver of system-wide risk under all scenarios.
7. Implied Default Probabilities
Using reduced-form credit pricing, the implied 1-year default probability for the KHR segment consistently exceeds that of the USD segment by a factor of 2 to 4, depending on the assumed recovery rate. This ratio has been relatively stable over time, reinforcing the structural nature of the risk differential.
Analysis Notebooks
Each step of the analysis is documented in a dedicated notebook. Click the links below to explore the full code, figures, and detailed interpretations.
| Notebook | Topic |
|---|---|
| 01 - Data Preparation | Data sourcing, cleaning, and spread computation |
| 02 - Exploratory Analysis | Descriptive statistics, time series visualization, correlation analysis |
| 03 - Parameter Estimation | OU model fitting via MLE with AR(1) cross-check |
| 04 - CRI Computation | Crisis thresholds, crisis probability, and CRI construction |
| 05 - Stress Testing | Stress scenario analysis under mild, moderate, and severe shocks |
| 06 - COVID-19 Analysis | Sub-period parameter estimation and structural break detection |
| 07 - Rolling Window | 36-month rolling parameter estimation and convergence analysis |
| 08 - Robustness Checks | Alternative rates, thresholds, and weights |
| 09 - Regime Switching | Two-state Markov Regime-Switching OU model |
| 10 - Dynamic Threshold | Rolling crisis threshold and dynamic CRI comparison |
| 11 - Implied Default Probability | Market-implied default probability estimation and recovery rate sensitivity |
| 12 - Policy Divergence | VAR model, Granger causality, and impulse response functions |
Footnotes
P-values close to 0 mean the relationship is statistically strong. A p-value below 0.05 is conventionally considered statistically significant.↩︎